
Hi, I'm Howard
Zhihao (Howard) Yao
MS, MBA
A Mathematical Statistician
with more than 10 years of experience
in data analytics and visualization

MS
Data Analytics, University of Maryland Global Campus

MBA
Health Science Management with emphasis on data analysis, University of Rochester

B.Sc
Pharmacy, China Pharmaceutical University
Programming:
Python, JavaScript, HTML/CSS
Statistical Tools:
SAS, R, STATA, SPSS
Database:
SQL, SQL Server, MySQL, Access, MongoDB
Visualization:
D3.js, Tableau, R Shiny
Edwards LifeScience Clinical & Medical Affairs Operational Excellence Award (2023)
For developing an automatic report generation program directly from the MEDIDATA RAVE database.
FDA CDRH Excellence in TPLC Regulatory Decision Making Award (2021)
For developing machine learning based Risk-Prediction model for FDA Establishment Identification Inspection.
FDA CDRH Excellence in Scientific Research Award (2019)
For development of rigorous statistical approaches for bioresearch monitoring (BIMO) site selection process and a tool called BIMO likelihood-ratio test inspection statistical software.
- Hu, T., Xu, J., Huang, L., Xu, Z., Yao, Z., Tiwari, R., (2020). Likelihood ratio test method for multiple medical device comparison using multiple site safety and effectiveness data with continuous outcomes, TIRS, 54(6):1444-1452.
- Xu, Z., Xu, J., Yao, Z., Huang, L., Jung, M., Tiwari, R., (2020) Evaluating Medical Device Safety Signals Using a Likelihood Ratio Test Method, JBS, 28;1-10, DOI: 10.1080/10543406.2020.1783284
- Jung, M., Ward, R., Xu, Z., Xu, J., Yao, Z., Huang, L., Tiwari, R, (2020). Application of a Likelihood Ratio Test Based Method for Safety Signal Detection to Left Ventricular Assist Devices, JBS, 26;1-8
- Xu, J., Huang, L., Yao, Z., Xu, Z., Zalkikar, J., & Tiwari, R. (2020). Statistical methods for clinical study site selection. Therapeutic innovation & regulatory science, 54(1), 211-219.
- Kucharska‐Newton, A., Griswold, M., Yao, Z. H., Foraker, R., Rose, K., Rosamond, W., ... & Windham, B. G. (2017). Cardiovascular disease and patterns of change in functional status over 15 years: findings from the Atherosclerosis Risk in Communities (ARIC) Study. Journal of the American Heart Association, 6(3), e004144.
- Tian, Y., Koganti, T., Yao, Z., Cannon, P., Shah, P., Pietrovito, L., ... & Lindsey, M. L. (2014). Cardiac extracellular proteome profiling and membrane topology analysis using glycoproteomics. PROTEOMICS–Clinical Applications, 8(7-8), 595-602.
- Tian, Y., Yao, Z., Roden, R. B., & Zhang, H. (2011). Identification of glycoproteins associated with different histological subtypes of ovarian tumors using quantitative glycoproteomics. Proteomics, 11(24), 4677-4687
-
Senior Principal Data Scientist, Edwards LifeScience
Dynamic dashboard reporting to leadership for data-driven decision-making
Automation programs for data management and analyses
Statistical and machine learning methods in clinical and medical affairs -
Mathematical Statistician, CDRH, FDA
Clinical trial data analysis, visualization, and statistics
Review and validate the quality and integrity of submitted data/TFLs from clinical trials
Creative programming skills with solid understanding of statistics and informatics methodology -
Data Management Analyst (NIH Contractor), NETE
Develop web applications, dashboards, dynamic reports and other HTML/CSS assets
Design and build publication-ready data visualizations using diverse sets of structured and unstructured data with D3.js and Tableau
Design and develop data science applications using Python -
Database Developer/Data Scientist, University of Mississippi Medical Center
Work with data architects, statisticians, and investigators to validate rules regarding data integrity and quality.
Design, develop, and maintain web-based dashboards and reporting solutions
Research underlying data and define an approach using SQL, SAS, and Python capabilities for enabling access and performance in Tableau and JavaScript. -
Data Analyst, Enlong
Work with teams to understand goals and data sources and help establish benchmarks and metrics of online marketing campaigns
Develop dashboards and reports using Excel VBA
Provided expert perspective on modeling approaches, technique, tools, and visualizations in resolving marketing-related business problem. -
Commercial Manager, Merck Serono, China
Analyze product data with application of SQL Server and develop channel coverage strategies and tactical plans using SSRS and Excel
Plan and manage channel-to-market development and analyse sales data from distributors to develop marketing report.
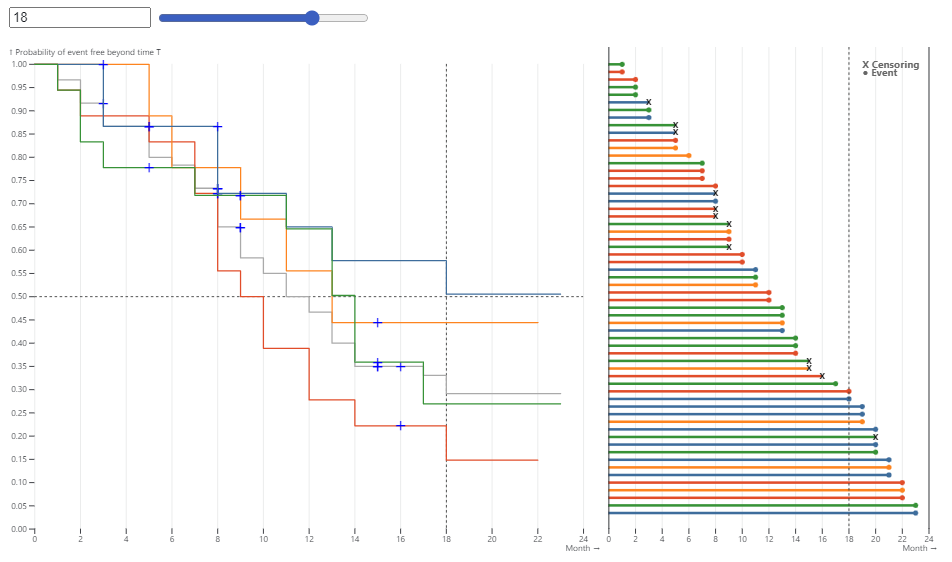
An Interactive Tool for Oncology Efficacy Analyses
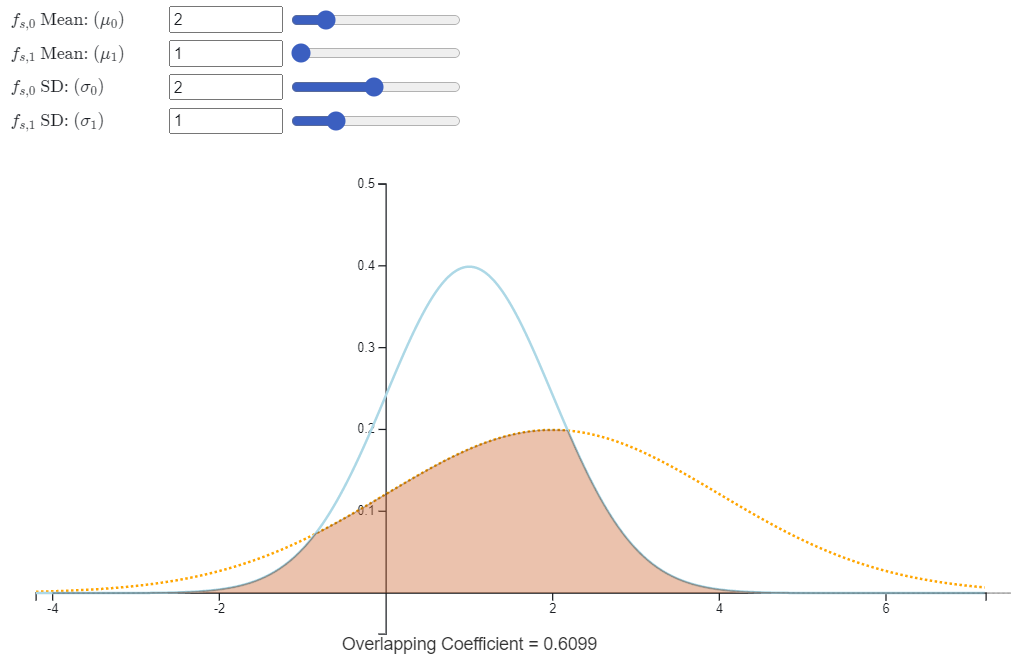
Leveraging External Evidence for Augmenting clinical Study
Propensity score-integrated power prior and PS-integrated composite likelihood approaches for leveraging real-world data in clinical studies.
VIEW
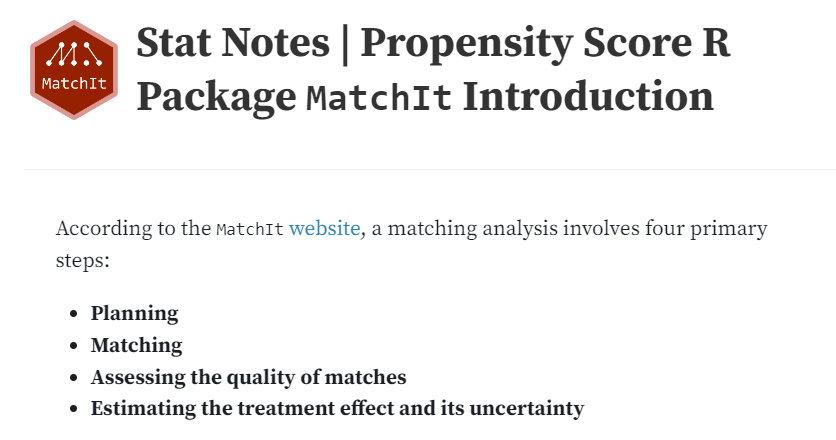
R Package MatchIt Introduction
MatchIt provides a simple and straightforward interface to various methods of matching for covariate balance in observational studies.
VIEW

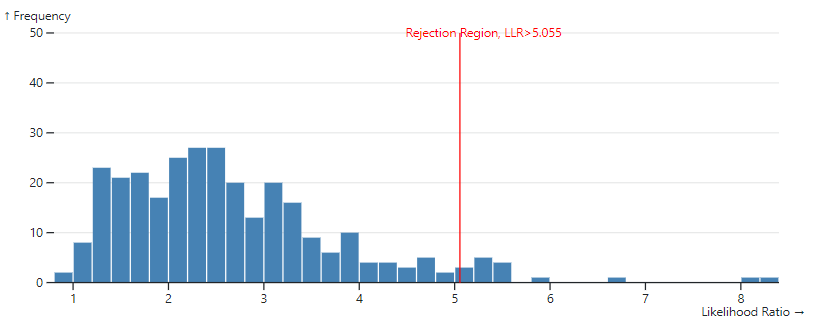
Likelihood Ratio-Based Test (LRT) Method
This demo introduces basic LRT method and applications of LRT methods to drug/device data in post-market safety surveillance
VIEW
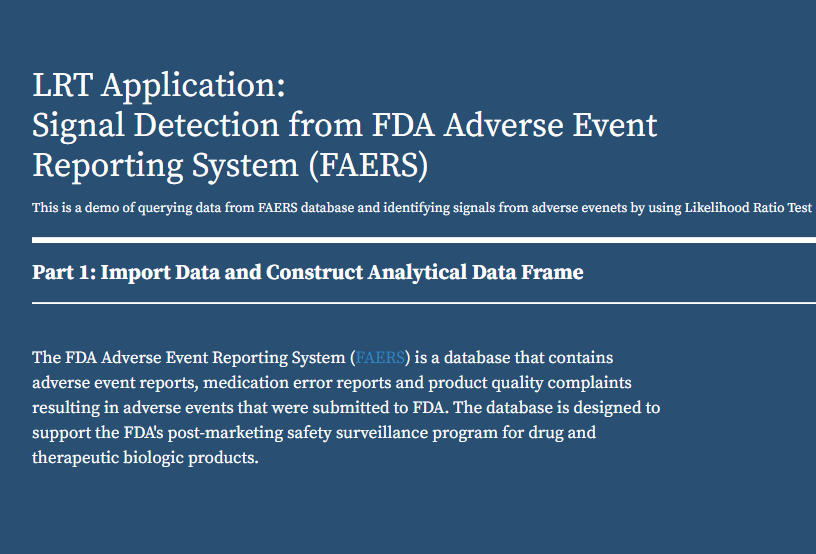
LRT Application Part 1: Data Wrangling
The goal is to create an adverse events data frame for further LRT analysis after querying and wrangling the JSON files from FAERS database
VIEW
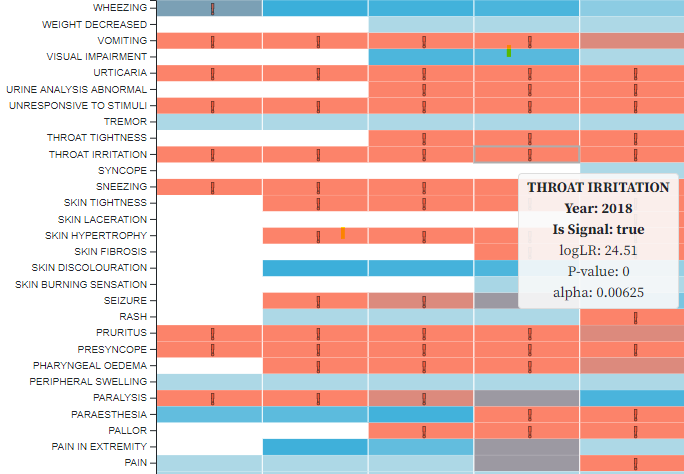
LRT Application Part 2: Signal Detection and Visualization
LRT method, via an extensive simulation study, retains good power and sensitivity for identifying signals
VIEW
LRT Signal Analysis Application
LRT Signal Analysis Application with dynamic parameters, such as name of drug, date range, and max number of events
VIEW
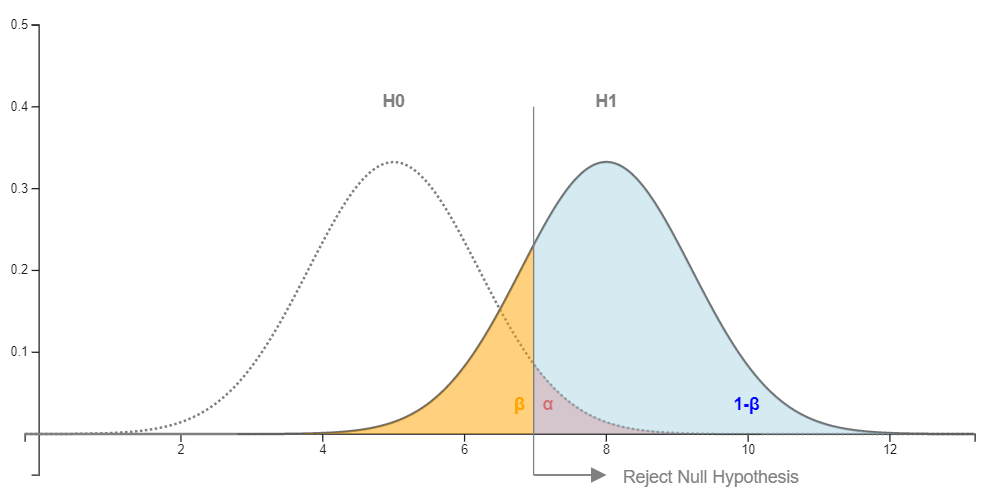
ML | 1 Introduction, Math, and Statistics
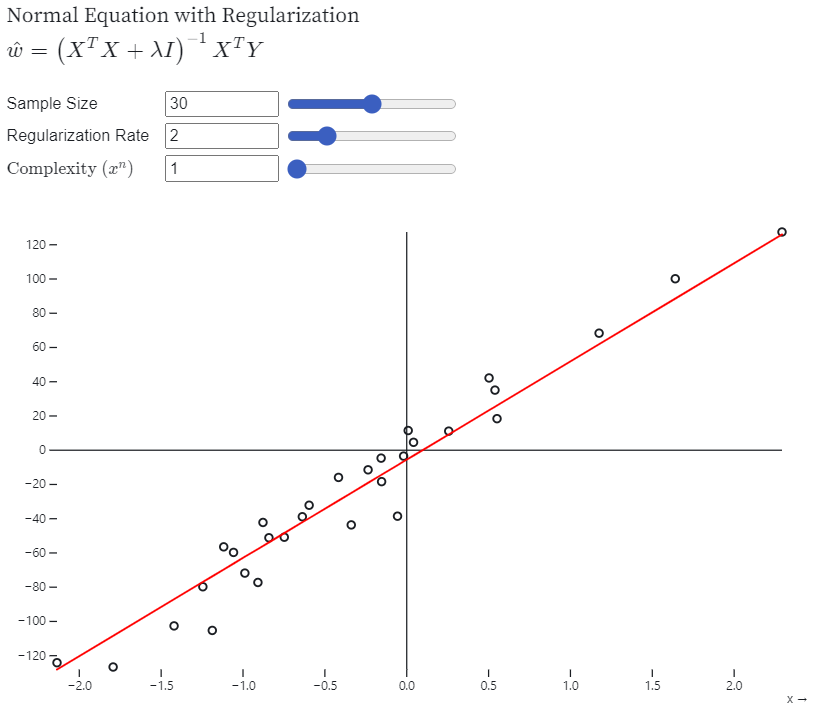
ML | 2 Linear Regression
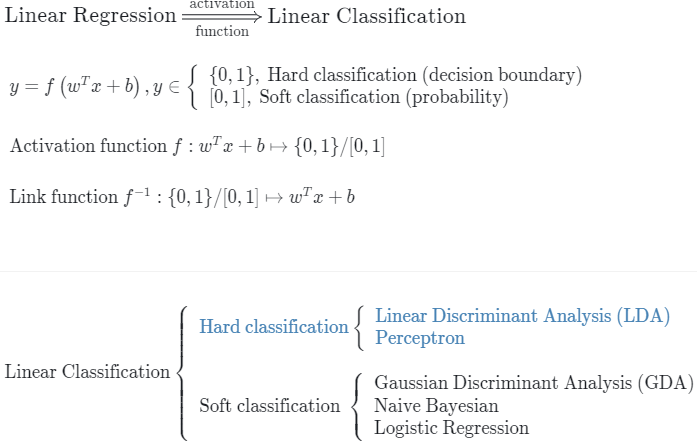
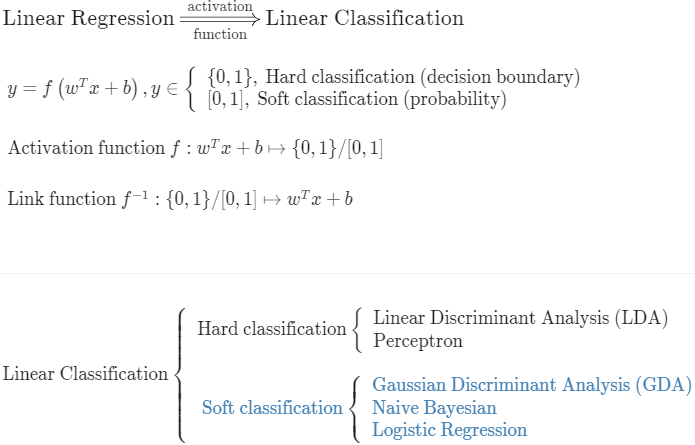
ML | 3.2 Linear Classification:
Logistic Regression & NB & GDA
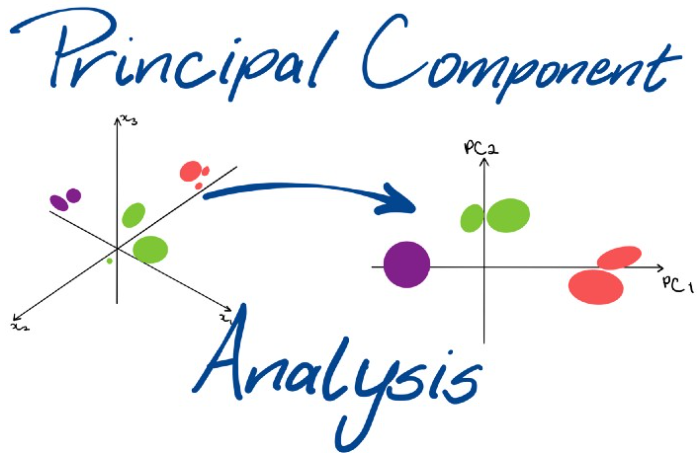
ML | 4 Dimensionality Reduction
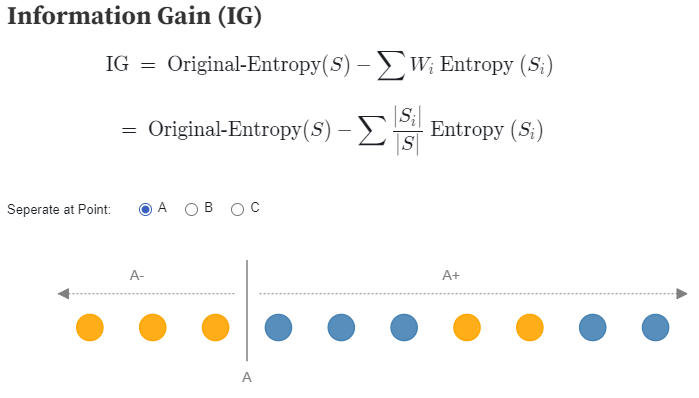
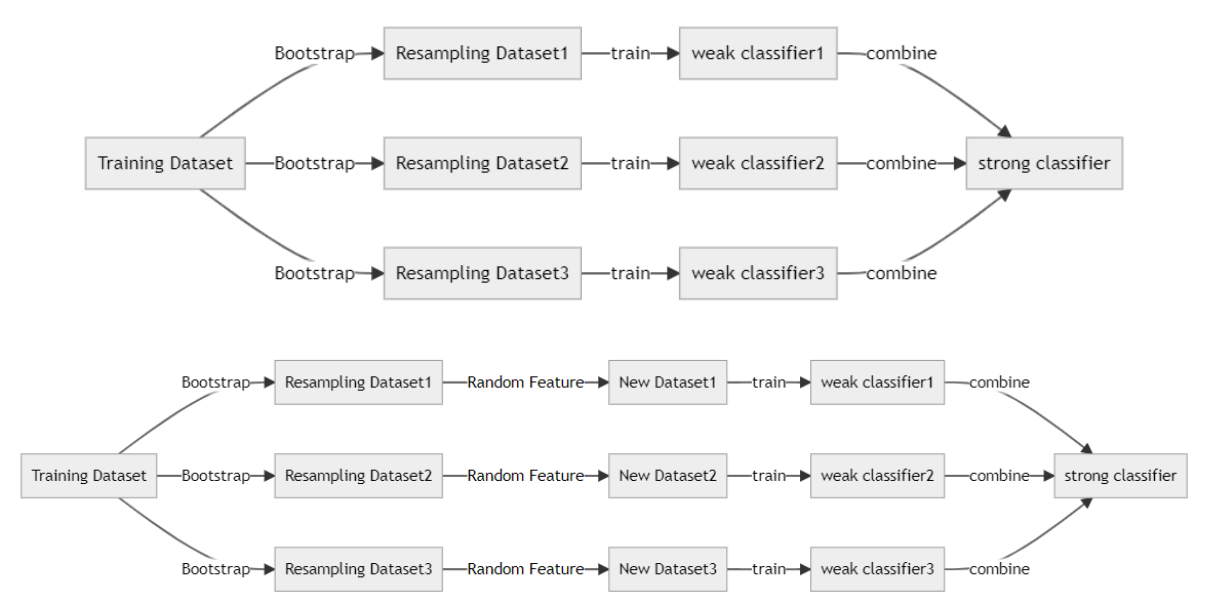
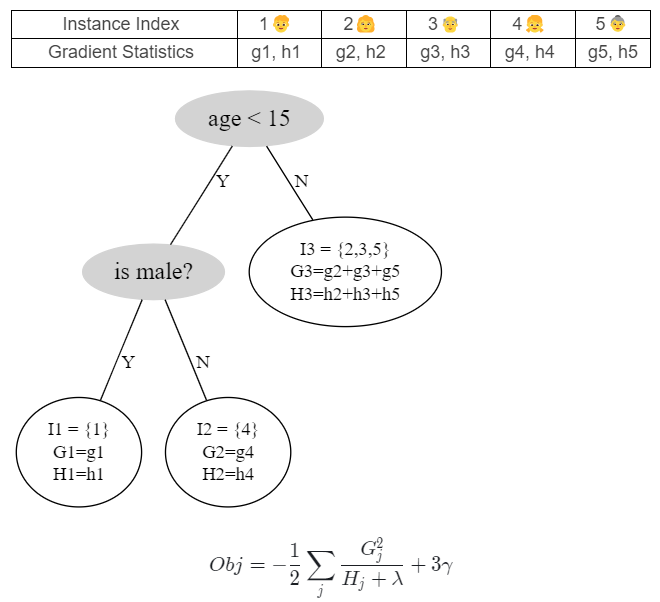
ML | 6 Decision Tree
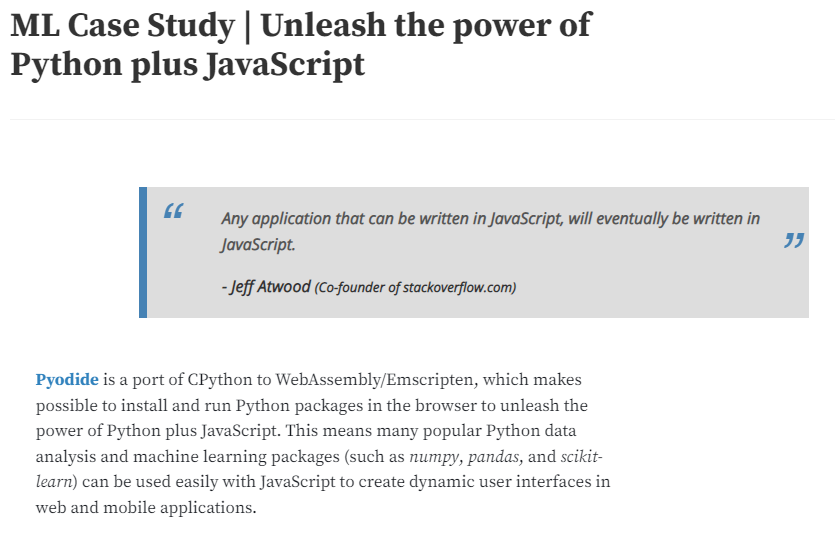
ML | Case Study
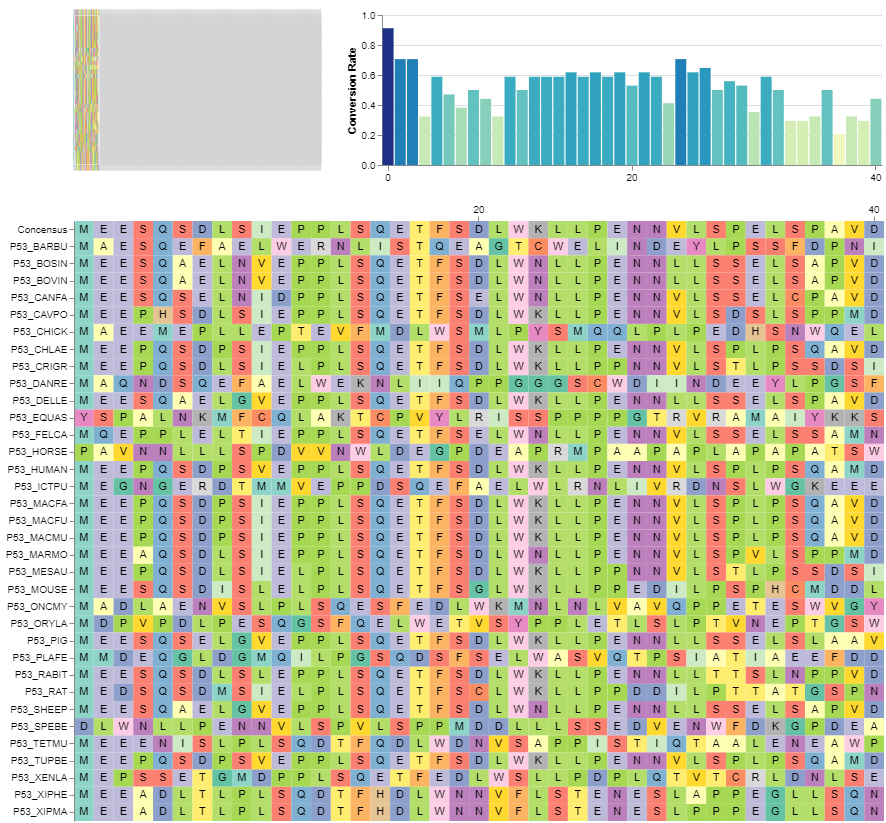
Sequence Alignment Dashboard
Protein sequences alignment dynamic dashboard. Mini-map can be used as a brush selector and concensus is made of the model of Amino Acids of proteins.
VIEW
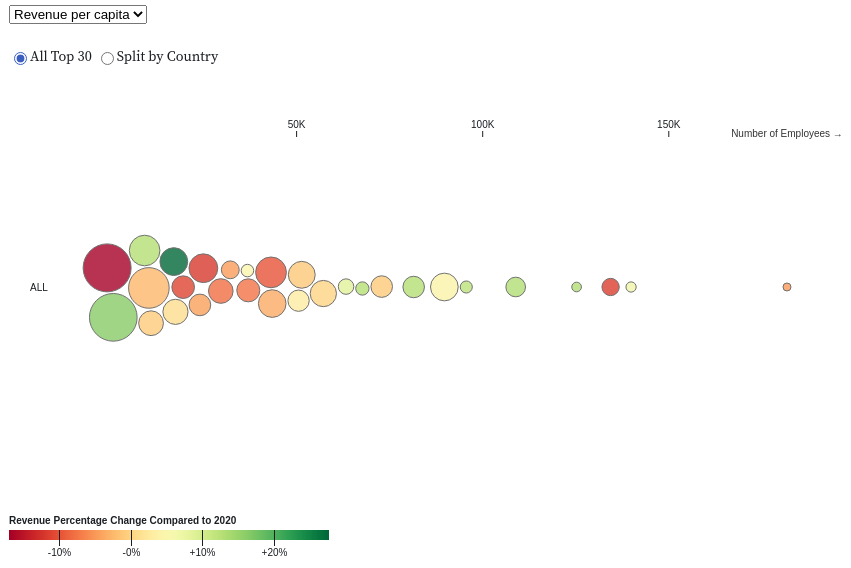
TOP 30 Medical Device Companies
Medical Product Outsourcing (MPO) magazine recently released "The 2021 MPO Top 30 Medical Device Companies Report". This visualization shows the detailed information of these companies - total revenue, profit change, revenue per capita, etc.
VIEW

Visualization Selection Diagram
This visualization is based on the chart selection diagram and the article "4 pillars of data visualization: distribution, relationship, composition, comparison"
VIEW
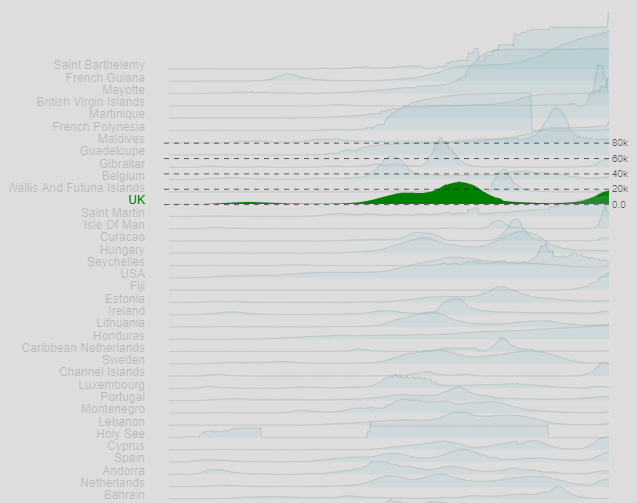
Covid-19 Global Dataset Visualization
Ridgeline plot allows greater precision for a given vertical space at the expense of occlusion (overlapping areas)
VIEW

Traveling Salesman Artwork
Traveling salesman problem (TSP) is an NP-hard problem in combinatorial optimization, important in theoretical computer science and operations research.
VIEW
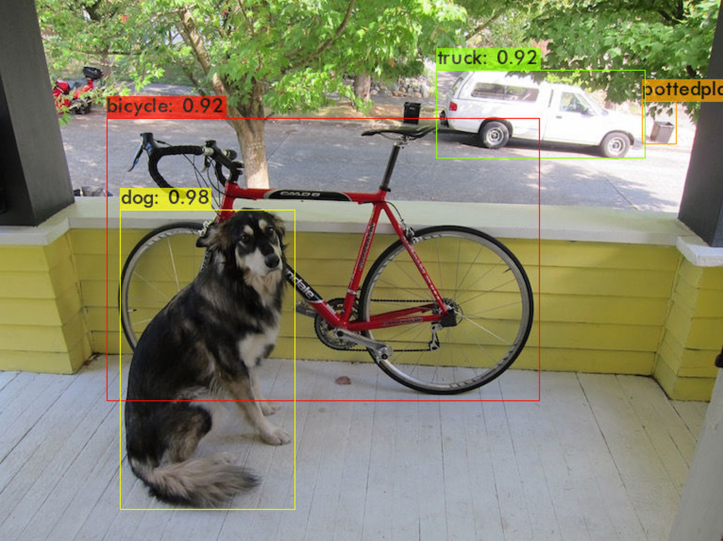
Object Detection Part 1: Custom YOLO V4 Model Training